Und dann auf "Zum Home-Bildschirm [+]".
Stöbern
genialokal zum Startbildschirm hinzufügen
Installieren Sie die genialokal App auf Ihrem Startbildschirm für einen schnellen Zugriff und eine komfortable Nutzung.
Installieren Sie die genialokal App auf Ihrem Startbildschirm für einen schnellen Zugriff und eine komfortable Nutzung.
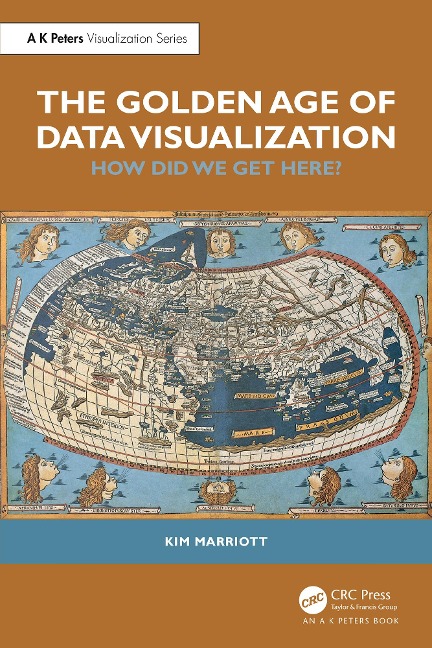
We are living in the Golden Age of Data Visualization. The COVID-19 pandemic has demonstrated how we increasingly use data visualizations to make sense of the world. Business analysts fill their presentations with charts, journalists use infographics to engage their readers, we rely on the dials and gauges on our household appliances, and we use mapping apps on our smartphones to find our way. This book explains how and why this has happened. It details the evolution of information graphics, the kinds of graphics at the core of data visualization-maps, diagrams, charts, scientific and medical images-from prehistory to the present day. It explains how the cultural context, production and presentation technologies, and data availability have shaped the history of data visualization. It considers the perceptual and cognitive reasons why data visualization is so effective and explores the little-known world of tactile graphics-raised-line drawings used by people who are blind. The book also investigates the way visualization has shaped our modern world. The European Renaissance and the Scientific Revolution relied on maps and technical and scientific drawings, and graphics influence how we think about abstract concepts like time and social connection. This book is written for data visualization researchers and professionals and anyone interested in data visualization and the way we use graphics to understand and think about the world.
Kim Marriott is a Professor in Computer Science at Monash University, where he leads the Monash Assistive Technology and Society (MATS) Centre. His research interests include data visualization and assistive technologies for people who are blind or have low vision.
1. The Beginning. 2. The Very Beginning. 3. Drawing Buildings and Machines. 4. Drawing Nature. 5. Mapping the World. 6. Mapping the State. 7. Seeing the Unseeable. 8. Visualizing Statistics. 9. Modern Visualization. 10. The Democratization of Visualization. 11. Visualization without Vision. 12. What's Next?
Dieses eBook wird im PDF-Format geliefert und ist mit einem Adobe Kopierschutz (DRM) versehen. Sie können dieses eBook mit allen Geräten lesen, die das PDF-Format und den Adobe Kopierschutz (DRM) unterstützen.
Zum Beispiel mit den folgenden Geräten:
• tolino Reader
Laden Sie das eBook direkt über den Reader-Shop auf dem tolino herunter oder übertragen Sie das eBook auf Ihren tolino mit einer kostenlosen Software wie beispielsweise Adobe Digital Editions.
• Sony Reader & andere eBook Reader
Laden Sie das eBook direkt über den Reader-Shop herunter oder übertragen Sie das eBook mit der kostenlosen Software Sony READER FOR PC/Mac oder Adobe Digital Editions auf ein Standard-Lesegeräte mit epub- und Adobe DRM-Unterstützung.
• Tablets & Smartphones
Möchten Sie dieses eBook auf Ihrem Smartphone oder Tablet lesen, finden Sie hier unsere kostenlose Lese-App für iPhone/iPad und Android Smartphone/Tablets.
• PC & Mac
Lesen Sie das eBook direkt nach dem Herunterladen mit einer kostenlosen Lesesoftware, beispielsweise Adobe Digital Editions, Sony READER FOR PC/Mac oder direkt über Ihre eBook-Bibliothek in Ihrem Konto unter „Meine eBooks“ - „online lesen“.
Schalten Sie das eBook mit Ihrer persönlichen Adobe ID auf bis zu sechs Geräten gleichzeitig frei.
Bitte beachten Sie, dass die Kindle-Geräte das Format nicht unterstützen und dieses eBook somit nicht auf Kindle-Geräten lesbar ist.